Statistically analyzing the color distribution of M&M’s is apparently a not too uncommon exercise to help students learn about probability, averages, and other useful statistics. I was first exposed to this activity while taking a statistics class at my college, but it’s a useful tool for anyone to learn these concepts. It’s also one of the few learning activities you can eat when you’re finished, which is never a bad thing.
I recently came into possession of two 14 ounce bags of Dark Chocolate M&M’s. Before I ate them I decided to see what the breakdown of colors was, and to see what other information that I could extract from them, useful or not.
Here’s what I discovered:
Searching the official M&M’s site(sound warning) turned up the following information on the breakdown of colors:
“Brown – 17%, Yellow – 17%, Red – 17%, Blue – 17%, Orange – 16%, Green – 16%”
I had two “Medium Size Bags” of Dark Chocolate M&M’s. Medium Size in this case means a bag of 14 ounces. I don’t actually have a scale, so I had to take the word on the packages that they did indeed each contain 14 ounces of M&M’s. Including broken pieces Bag 1 had 462.5 M&M’s and Bag 2 had 466 M&M’s Giving us a grand total of 928.5 M&M’s. Dividing the number of M&M’s in the bag by the number of ounces on the bags gives us 33.04 M&M’s/oz for Bag #1, 33.29 M&M’s/oz for Bag #2, or an average of 33.16 M&M’s/oz.
Awesome.
Next I decided to look at the breakdown of the colors to see what distribution of colors the manufacturer determined was aesthetically pleasing. My counting results are in the following table:
| Bag #1 | Bag #2 | Total | |
| Red | 62.5 | 71.5 | 134 |
| Orange | 80 | 82 | 162 |
| Blue | 78 | 76 | 154 |
| Brown | 78.5 | 82.5 | 161 |
| Green | 78.5 | 64 | 142.5 |
| Yellow | 85 | 90 | 175 |
| Totals | 462.5 | 466 | 928.5 |
So, what does that mean? Well, by itself, not much yet, so let’s throw some more math at it.
The following table shows the percentage of each color in each bag, and then the overall percentage of each color.
| Bag #1 | Bag #2 | Overall | |
| Red | 13.51% | 15.34% | 14.43% |
| Orange | 17.30% | 17.60% | 17.45% |
| Blue | 16.86% | 16.31% | 16.59% |
| Brown | 16.97% | 17.70% | 17.34% |
| Green | 16.97% | 13.73% | 15.35% |
| Yellow | 18.38% | 19.31% | 18.85% |
Putting the data into delicious pie-form yields the following three graphs:
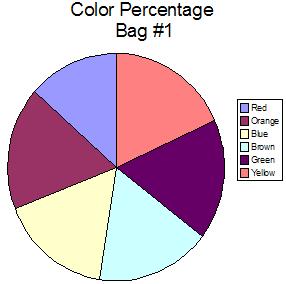
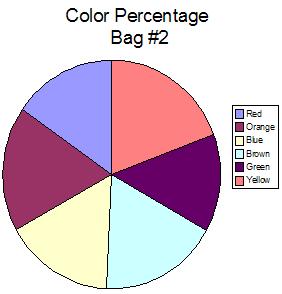
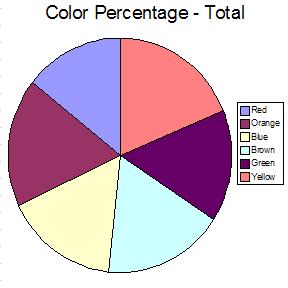
Most of these percentages are reasonably close to the above-mentioned distribution (Brown – 17%, Yellow – 17%, Red – 17%, Blue – 17%, Orange – 16%, Green – 16%). However, there are a few anomalies: Red is consistently low, Green is inconsistent but averages low, and Yellow is significantly higher than the 17% reported by the website.
So far, so good, but I felt the need to proceed further to unlock other secrets this mountain of treats held, so I pressed on, and threw another graph at it.
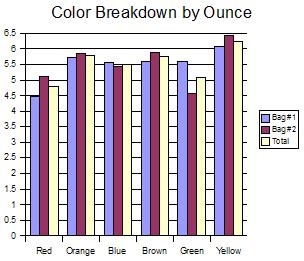
Dividing the number of M&M’s I counted in each bag by the weight printed on the bags told me that there are approximately 33 candies in one ounce of M&M’s. Using the percentages calculated above, any one ounce will have colors in roughly the following quantities:
| Bag #1 | Bag #2 | Overall | |
| Red | 4.46 | 5.11 | 4.79 |
| Orange | 5.71 | 5.86 | 5.79 |
| Blue | 5.57 | 5.43 | 5.5 |
| Brown | 5.61 | 5.89 | 5.75 |
| Green | 5.61 | 5.89 | 5.75 |
| Yellow | 6.07 | 6.43 | 6.25 |
From this we can extrapolate that a ‘small bag’ (1.79 ounces) of Dark Chocolate M&M’s will have an approximate breakdown as follows:
| Small Bag | |
| Red | 8.57 |
| Orange | 10.36 |
| Blue | 9.85 |
| Brown | 10.29 |
| Green | 9.11 |
| Yellow | 11.19 |
Needlessly extracting further information tells us that, given the admittedly small sample size, when reaching into a new bag of Dark Chocolate M&M’s your chances of pulling out a specific color can be approximated by the table below:
| Chance of Pulling out One Color | |
| Red | 14.43% |
| Orange | 17.45% |
| Blue | 16.59% |
| Brown | 17.34% |
| Green | 15.35% |
| Yellow | 18.85% |
Could we go further? Of course! The sky’s the limit, really. I just ran out of fun graphs to try. Feel free to take my sample data and compare it with your own, or do anything you want with it. Copy it, teach with it, grade it and tell me what I did wrong. Just drop me a line to let me know where it ends up.